Set-up financial intelligence w/ LLMs
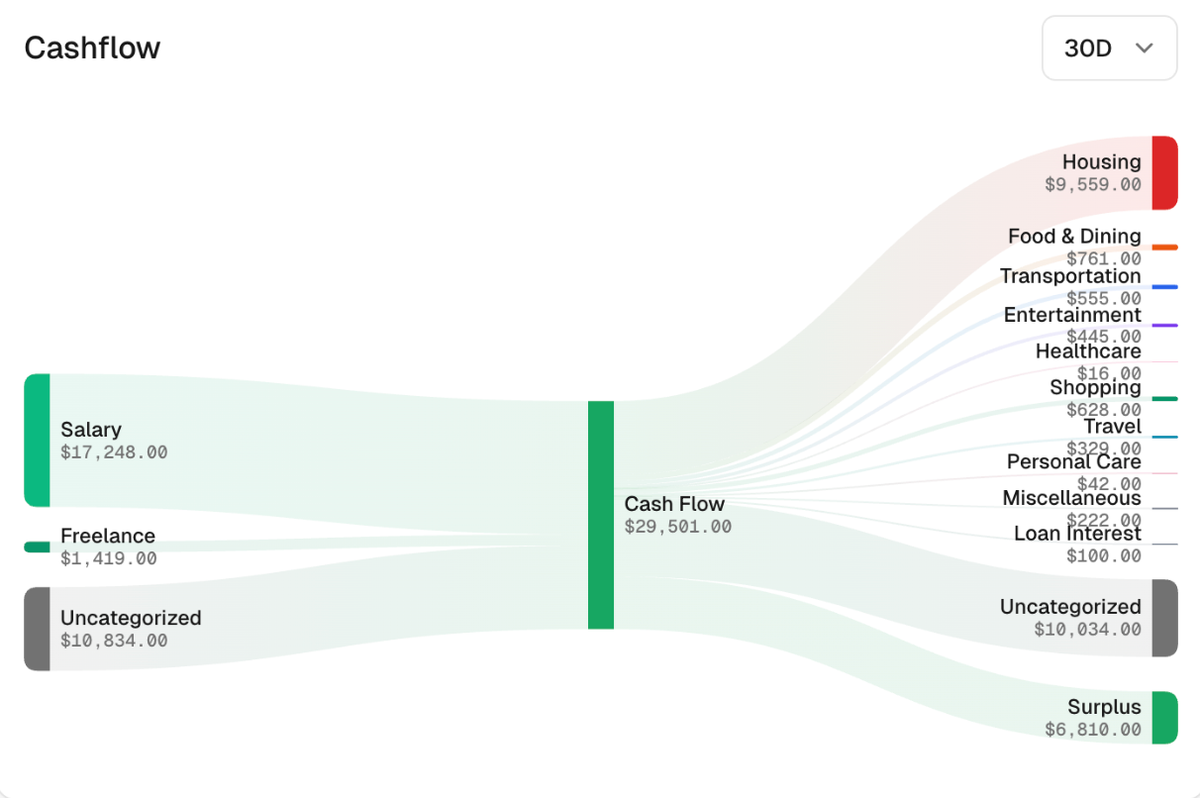
If you have more than a couple of bank accounts, maybe some investments, a pension fund, crypto - you already know the problem. No single app sees all of it. You can't answer basic questions like "what's my actual savings rate" or "am I on track for the goals I set this year." You're making financial decisions - how much to invest, how much to set aside for kids, whether a property is worth keeping - based on fragments.
I built a pipeline that consolidates everything into one place. And then something unexpected happened - once the data was clean and unified, I could point an LLM at it and get insights I'd never thought to ask for:
- "Your grocery spending increased 23% since January, mostly driven by weekend shopping. Weekday spending is flat."
- "At your current savings rate, you'll hit your investment target 4 months late. Cutting subscriptions alone closes the gap."
None of this is possible when your data lives in 8 different apps. Here's how I set it up.
Architecture
The dashboard is Sure.am, self-hosted on a home server behind Tailscale. No public exposure, no subscription, no third party holding my financial data. The infrastructure is a small Docker stack - Rails app, Sidekiq for background jobs, PostgreSQL, Redis, and automated backups. Cost: hardware I already owned.
graph LR
    subgraph Automated["Automated Sync"]
        B1[Brokerage accounts]
        CR[Crypto wallets]
        BA[Bank accounts]
    end

    subgraph Manual["Manual Export"]
        LEGACY[Legacy banks\nno API]
        PENSION[Pension funds]
        STOCK[Employer stock plan]
    end

    subgraph Aggregators["Sync Layer"]
        ST[SnapTrade]
        CS[CoinStats]
        EB[Enable Banking\nPSD2]
        PY[Python Parsers]
    end

    B1 --> ST
    CR --> CS
    BA --> EB
    LEGACY -->|CSV export| PY
    PENSION -->|PDF export| PY
    STOCK -->|PDF export| PY

    ST --> SURE[Sure.am]
    CS --> SURE
    EB --> SURE
    PY -->|API push| SURE

    SURE --> DB[(PostgreSQL)]
The split between automated and manual is just a fact of life. SnapTrade connects brokerage accounts without me touching anything. CoinStats tracks crypto wallets via public keys. Enable Banking uses PSD2 open banking for European bank accounts.
That covers roughly half of my accounts. The other half don't have APIs - they have exports. Some banks give you CSV files. Pension funds and stock plan providers give you PDFs. So there are a few Python parsers that handle the conversion and push transactions to Sure's API. The CSV parser got out of hand (over a thousand lines, partly the bank's fault and partly mine). The PDF parsers are more reasonable.
Categorization engine
Raw transactions aren't useful. Categorized transactions are. And this is where every off-the-shelf tool fails you - because the right categories are specific to your life, not to some generic taxonomy a product team designed.
The categorization logic takes three inputs for every transaction: the merchant name, the amount, and which account it came from. The combination of all three is what determines the category.
flowchart TD
    TX[Transaction] --> M{Merchant name\nmatches?}
    M -->|Yes| A{Amount\ncontext?}
    M -->|No| MISC[Miscellaneous]

    A -->|Large| CAT1[Primary category\ne.g. Fuel]
    A -->|Small| CAT2[Alternate category\ne.g. Groceries]
    A -->|Ambiguous| AC{Account\ncontext?}

    AC -->|Investment property account| PROP[Property sub-category]
    AC -->|Personal account| PERS[Personal category]
    AC -->|Direction: inflow| INC[Income]
    AC -->|Direction: outflow| EXP[Expense]
The same merchant can mean completely different things. A fuel station charge under CHF 15 is a coffee. Over CHF 15 it's actual fuel. My employer shows up as the same merchant name for both salary deposits and cafeteria lunches - the only signal is the amount. A payment to Kanton Zürich is either a tax bill or a tax refund depending on which direction the money flows.
Banks auto-categorize all of these and call it done. Technically correct. Completely useless.
The categorization rules grow over time. You add them as you encounter edge cases. The first version doesn't need 95 rules - it needs enough to stop calling things "Miscellaneous."
Killer use case: property tracking
If you own a rental property, this is where it gets real.
On paper, a rental looks profitable. Rent income comes in, mortgage goes out, the difference is positive.
But "rent minus mortgage" isn't profitability. It's a napkin estimate. The real number is rent income minus mortgage minus condo charges minus building insurance minus utilities minus property management fees minus cantonal property tax minus the occasional plumber.
graph TD
    RENT[Rent Income] -->|inflow| NET[Net Profitability]

    MORT[Mortgage] -->|outflow| NET
    CONDO[Condo Charges] -->|outflow| NET
    INS[Building Insurance] -->|outflow| NET
    UTIL[Utilities] -->|outflow| NET
    MGMT[Property Management] -->|outflow| NET
    TAX[Property Tax] -->|outflow| NET
    MAINT[Maintenance\nad hoc] -->|outflow| NET
Seven sub-categories for one property. Every transaction tagged. Every cost visible. Now you can see the real profitability - and see it trend over time, not just as a snapshot.
This is the question no banking app can answer: is this property actually worth owning? The answer requires data from multiple accounts, properly categorized, unified in one place. Without the pipeline, you're guessing.
Infrastructure
The whole thing runs on a home server behind Tailscale. No public ports, no cloud bills, no third party with access to my financial data.
graph LR
    ME[My Devices] -->|Tailscale VPN| HS[Home Server]

    subgraph Docker["Docker Stack"]
        RAILS[Rails App\nSure.am]
        SQ[Sidekiq\nBackground Jobs]
        PG[(PostgreSQL)]
        RD[(Redis)]
        BK[Backup\nCron]
    end

    HS --> Docker
    RAILS <--> SQ
    RAILS <--> PG
    SQ <--> RD
    BK -->|daily dump| PG
Sure.am is open source, which matters. I can read the code, run it myself, and push transactions via its API without depending on anyone's pricing decisions. The self-hosted model means the data stays local. Tailscale means I can access the dashboard from anywhere without exposing anything to the internet.
The parsers run locally too - I export files from my bank and pension provider, run the scripts, and the transactions appear in Sure. Quarterly for some, whenever I remember for the others.
What sucked
Honesty requires covering the SnapTrade migration.
I had four custom Python cron fetchers for my brokerage accounts. Replaced them with Sure's native SnapTrade integration. Right call. But SnapTrade re-imported three years of trade history on every sync until I found sync_start_date buried in the documentation.
One of my accounts had 937 trades across 130 securities. Sure's reverse calculator tried to fetch prices for all 130 from Yahoo Finance. Yahoo rate-limited aggressively. Cascading errors. Fun afternoon.
Fixed it by cleaning up historical trades for closed positions, keeping only the active ones, and setting the sync window to 30 days. Sync went from broken to instant.
The honest accounting: I spent probably 40 hours writing custom fetchers that Sure's built-in providers replaced in an afternoon. Building the thing you should have just configured is apparently a rite of passage.
What it actually reveals
Net worth as one number: all accounts, all asset types, all currencies, normalized. Updated whenever providers sync or whenever I run the parsers. Not a spreadsheet I update manually once a quarter.
Real spending categories. "Miscellaneous" is not a category. "Groceries vs convenience store snack at a fuel station" is a category. "Work lunch vs restaurant dinner" is a category. "Tax payment vs tax refund" is a category. Once you have these, you can actually see where your money goes.
Currency exposure. If you earn in one currency but hold assets in several, that split matters. No banking app shows it.
Pension performance over time. Not a static balance on a PDF I download once a year - a tracked number with history.
Employer stock in the same view as everything else. If your company uses a stock plan provider, you know the pain of logging in and squinting at a PDF. I parse mine quarterly and push a valuation. Annoying. Also the only way to see your total compensation picture.
Actual savings rate per quarter. Actual spending trends over time. The questions you can ask once you have clean, categorized, unified data are just different.
So what
The architecture isn't complicated. A self-hosted dashboard, a few sync providers, some parsers for the institutions that don't have APIs, and a categorization layer that reflects how you actually live. The complexity in my setup comes from the number of institutions, not from the approach itself.
You don't need a complex setup to get value from this. Start with whatever you have. Connect what you can automatically. Write a simple parser for what you can't. Add categorization rules as you encounter edge cases.
Financial literacy isn't a skill you learn from a book. It's a pipeline you build. Once you can query your own financial data - not just look at it, but actually query it - the questions change. Not "what's my balance" but "what's my real savings rate this quarter" and "is this apartment actually worth owning after all costs."
The data is yours. Getting it back just requires some engineering.
If you want to talk about this or build something similar, I'm on GitHub and LinkedIn.